15 days to goBritish Columbia votes on Saturday, October 24, 2026

Get in front of undecided British Columbia voters
MLA · BC PROVINCIAL 2026

West Vancouver-Capilano.
4 candidates, one seat.

This district elects one MLA. Voters mark one name on Saturday, October 24, 2026, and the candidate with the most votes wins the seat.

West Vancouver-Capilano is a provincial electoral district on the north shore of Burrard Inlet. It takes in West Vancouver from Cypress Creek and Rodgers Creek eastward, and the part of the District of North Vancouver between the Capilano River and Lonsdale Avenue. The 2021 census counted 62,585 people in it, and the Electoral Boundaries Commission gives its area as 81 square kilometres.

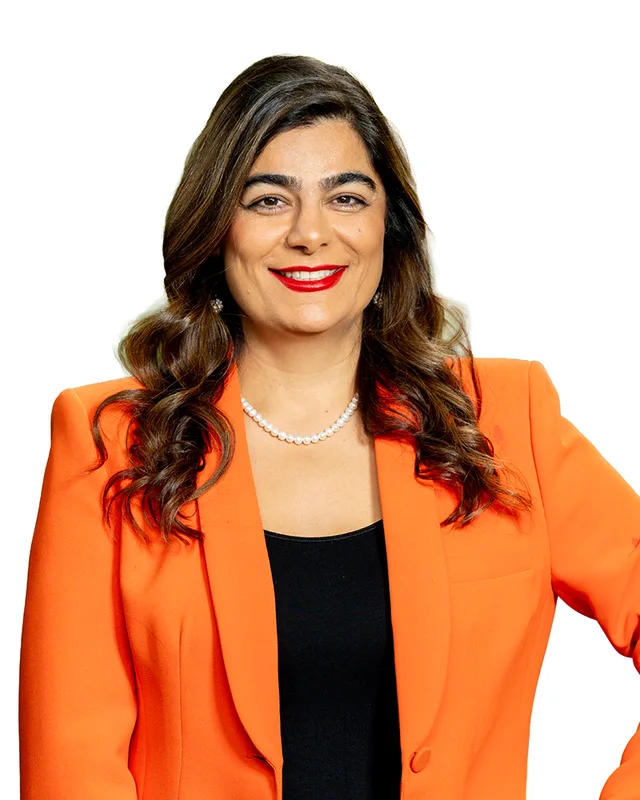
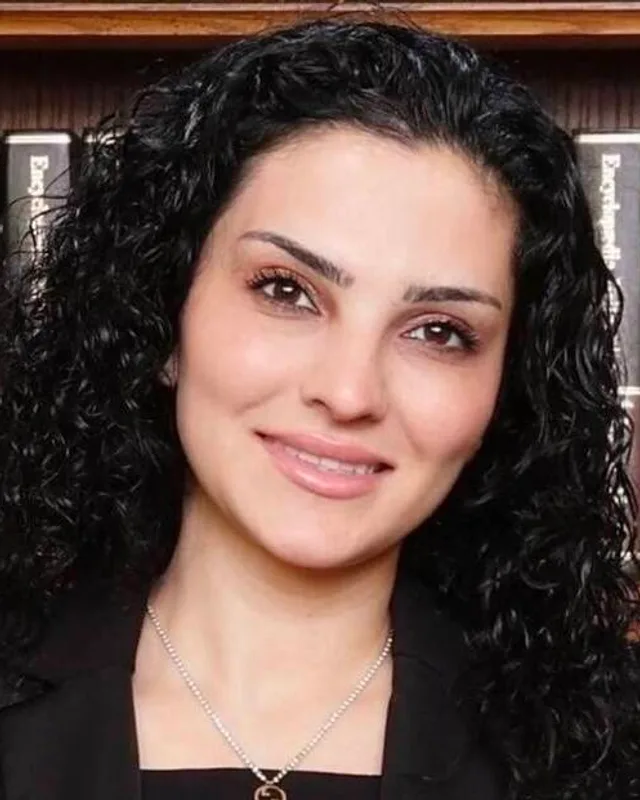
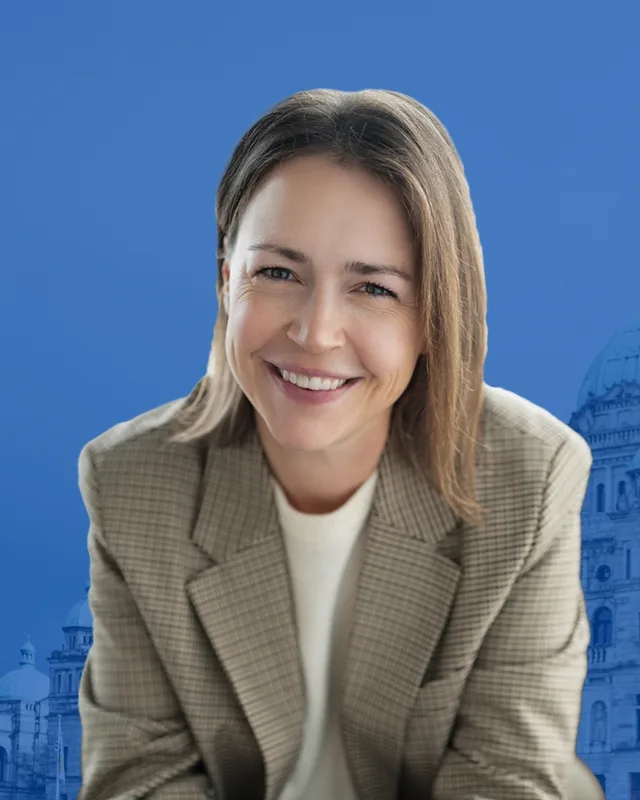
The candidates

In alphabetical order
People, 2021 census
62,585
Area
81 km²
Registered voters, 2024
44,114
Turnout, 2024
58.62%
Median age
48.4
Median household income, 2020
$105,000
THE DISTRICT

Where West Vancouver-Capilano is

81 km² · 62,585 people

West Vancouver-Capilano lies on the north shore of Burrard Inlet. The Electoral Boundaries Commission's 2023 final report says it consists of West Vancouver's city centre, Pemberton Heights, Ambleside, Park Royal, Dundarave, Sandy Cove and the part of Westmount south of the Upper Levels Highway. In the north and south it follows the boundaries of the District of West Vancouver. Its western boundary follows Cypress Creek and Rodgers Creek. Its eastern boundary follows Mosquito Creek, Montroyal Boulevard and Lonsdale Avenue.

The commission's map shows that the district reaches east across the Capilano River into the District of North Vancouver. It labels Pemberton Heights, Delbrook, Forest Hills, Capilano Highlands, Canyon Heights and Cleveland Park on that side of the river. BC Geographical Names records that the river flows south into the First Narrows of Burrard Inlet. The Squamish Nation's Capilano 5 Reserve lies beside the district's southeast corner. The report says the western boundary of North Vancouver-Lonsdale follows the Lions Gate Bridge to the Capilano 5 Reserve and north to Marine Drive, and its map draws the reserve inside that district.

North of the shore, the map shows Capilano Lake, Capilano Watershed Regional Park, Capilano River Regional Park and part of Cypress Provincial Park inside the boundary. It names Brothers Creek, Lawson Creek, McDonald Creek and Marr Creek. The map shows Highway 1 and Highway 99 crossing the district, with Marine Drive along the shore. The Canadian Encyclopedia names the Upper Levels Highway and Marine Drive as the two highways that run through West Vancouver.

  • West Vancouver city centre
  • Ambleside
  • Park Royal
  • Dundarave
  • Sandy Cove
  • Westmount
  • Altamont
  • Hollyburn
  • Sentinel Hill
  • Cedardale
  • British Properties
  • Glenmore
  • Pemberton Heights
  • Capilano Highlands
  • Canyon Heights
  • Cleveland Park
  • Forest Hills
  • Delbrook

Sources: British Columbia Electoral Boundaries Commission (opens in a new tab), BC Geographical Names Office (opens in a new tab), The Canadian Encyclopedia (opens in a new tab)

HISTORY

The history of the area

Checked Thursday, October 8, 2026

Squamish and Tsleil-Waututh territory

Two Nations describe this shore as part of their territory, each in its own words. The Squamish Nation, Sḵwx̱wú7mesh Úxwumixw, gives its traditional territory as 6,732 square kilometres. Its website says the territory includes parts of Vancouver, Burnaby and New Westminster, and all of North Vancouver, West Vancouver, Port Moody, the District of Squamish and the Municipality of Whistler. It says the boundaries take in all of Howe Sound, Burrard Inlet and English Bay, with the rivers and creeks that flow into them, and that village sites in the territory date back 3,000 years.

The Tsleil-Waututh Nation calls itself səlilwətaɬ, the People of the Inlet, and names its language hən̓q̓əmin̓əm. Its website says traditional use studies and archaeological evidence show that its ancestors occupied a vast area, and that they have lived in their traditional territory for thousands of years. It lists the Indian, Capilano and Seymour rivers among the places where families gathered to fish for salmon in the fall and early winter. The Nation says it never ceded or relinquished its responsibility for the territory.

Sources: Squamish Nation (Sḵwx̱wú7mesh Úxwumixw) (opens in a new tab), Tsleil-Waututh Nation (səlilwətaɬ) (opens in a new tab), Tsleil-Waututh Nation (səlilwətaɬ) (opens in a new tab)

The Capilano name and the Squamish reserves, 1876 to 1923

The river that runs through the district takes its name from the Squamish language. BC Geographical Names says the name derives from Kiapila'noq, the hereditary title of a Squamish chief whose village stood at the mouth of the creek. The name was adopted as Capilano Creek on 31 March 1917 and changed to Capilano River on 6 May 1947.

The Squamish Nation's history page says reserve lands along Howe Sound and Burrard Inlet were allotted and surveyed between 1876 and 1888, and that 26 reserves were assigned for the use of the Squamish people. Between 1901 and 1915, it says, various reserve lands were leased out or sold for industrial sites. In 1911 the federal government amended the Indian Act to allow the Crown to purchase urban reserves without the consent of the people living there. On 23 July 1923, sixteen bands with a combined population of 412 members were united into one Squamish Nation.

Sources: BC Geographical Names Office (opens in a new tab), Squamish Nation (Sḵwx̱wú7mesh Úxwumixw) (opens in a new tab)

West Vancouver becomes a municipality, 1912

The North Shore Heritage Preservation Society says the District of North Vancouver was incorporated in 1891 and originally extended from Deep Cove to Horseshoe Bay. The Canadian Encyclopedia lists Horseshoe Bay among the attractions of West Vancouver, so the shore that became West Vancouver lay inside that first boundary. BC Geographical Names records that West Vancouver was incorporated on 15 March 1912, and the West Vancouver Police Department's history page says its first District Council was elected on 6 April 1912.

The Canadian Encyclopedia says North Vancouver extends from the Capilano River on the west to beyond Deep Cove on the east, and its article on West Vancouver names North Vancouver as West Vancouver's eastern neighbour. The electoral district crosses the Capilano River and joins West Vancouver with Capilano Highlands, Delbrook and Pemberton Heights on the eastern bank. BC Geographical Names places West Vancouver on the north side of Burrard Inlet, west of North Vancouver.

Sources: North Shore Heritage Preservation Society (opens in a new tab), BC Geographical Names Office (opens in a new tab), West Vancouver Police Department (opens in a new tab), The Canadian Encyclopedia (opens in a new tab), The Canadian Encyclopedia (opens in a new tab), British Columbia Electoral Boundaries Commission (opens in a new tab)

The ferry to Vancouver, 1909 to 1947

Before there was a bridge, people crossed Burrard Inlet by boat. Scout Magazine reports that the West Vancouver Ferry Company was formed in 1909 by Lawson and Thompson with Robert Macpherson and John Sinclair. By 1912 Lawson had spent more than $11,500 on the service and boats. In 1912 the new municipality bought the company for $6,000. In 1913 a terminal with a ticket office and a tea room was built at the foot of 14th Street. The standard run went from there to the foot of Columbia Street on the Vancouver waterfront. The trip took 25 minutes, ran on the hour and cost 10 cents. West Vancouver's boats made their last sailing in 1947.

The Encyclopedia of Raincoast Place Names says that Dundarave was named by Russell E Macnaughton, an assistant professor of Greek at the University of British Columbia. Dundarave Castle on Loch Fyne in Scotland was the ancestral home of the MacNaughtons. The same entry says the Dundarave pier was built in 1914.

Sources: Scout Magazine (opens in a new tab), KnowBC (opens in a new tab)

The Guinness family and the Lions Gate Bridge, 1931 to 1939

British Pacific Properties says on its own history page that it was incorporated in 1931 by a group of investors led by members of the Guinness family. The company says it designed, built and financed the Lions Gate Bridge, which opened ahead of schedule in November 1938. The Canadian Encyclopedia's article on the bridge agrees that the Guinness family paid for it.

That article says construction began on 31 March 1937 and the bridge opened to traffic on 14 November 1938. King George VI and Queen Elizabeth presided over the official opening on 29 May 1939. The Guinness family paid $5,873,837.17 to build the bridge and sold it to the province for that same amount in 1955. The Canadian Encyclopedia's article on West Vancouver says the company's investments started residential growth after the Second World War.

Sources: British Properties (British Pacific Properties) (opens in a new tab), The Canadian Encyclopedia (opens in a new tab), The Canadian Encyclopedia (opens in a new tab)

Park Royal opens, 1950

Park Royal's own history page says construction began in August 1949, when W. C. Woodward turned the first shovel of earth. The first phase included a Woodward's department store, a Woodward's food store and 25 other stores and services. The page gives the size as 120,000 square feet on 11½ acres, at a cost of $1.5 million, and says the centre opened for business in the fall of 1950. It says the Earl of Iveagh suggested the name because a Guinness brewery stood in the Park Royal district of London.

The same page says that on 4 August 1961 Chief Mathias Joe turned the first shovel of earth on property that British Pacific Properties leased from the Squamish Nation, under a lease of 99 years. It says the south mall was completed in 1962, and that in 1969 the north mall was converted from an unenclosed strip centre to an enclosed shopping centre.

Sources: Park Royal (opens in a new tab)

The Cleveland Dam on the Capilano River, 1952 to 1954

Metro Vancouver's fact sheet says Cleveland Dam stands on the Capilano River in a deep and narrow rock canyon, next to Capilano River Regional Park and immediately upstream of the Capilano Salmon Hatchery. The dam was built between 1952 and 1954 at a cost of $10.7 million. Metro Vancouver, through the Greater Vancouver Water District, owns and operates it. The fact sheet lists two later upgrades: a $3 million seismic upgrade in 1992, and a $25 million upgrade in 2001 and 2002 to the East Abutment, the section of soil beside the concrete dam.

The commission's 2023 map shows Capilano Lake, Capilano Watershed Regional Park and Capilano River Regional Park inside the district's boundary.

Sources: Metro Vancouver (opens in a new tab), British Columbia Electoral Boundaries Commission (opens in a new tab)

THE SEAT

Who has held the seat

Legislative Assembly records, 35th Parliament onward

Elections BC's volume for 1987 to 2001 first prints West Vancouver-Capilano at the 35th general election, held on 17 October 1991. The Electoral Districts Act (SBC 1990 c. 39), assented to on 27 July 1990, set out 75 single-member districts to replace multi-member districts. It took effect when the 35th Parliament was dissolved on 19 September 1991. Jeremy Dalton of the Liberal Party won the district in 1991 with 13,194 votes (56.63%), ahead of John Reynolds of the Social Credit Party with 6,161 (26.44%) and Helen Chaplin of the New Democratic Party with 3,740 (16.05%).

Elections BC's volume for 1871 to 1986 lists two earlier districts with similar names, North Vancouver-Capilano and West Vancouver-Howe Sound. The Constitution Amendment Act of 1966 (SBC 1966 c. 11) created both, and both were contested from 1966 to 1986. In North Vancouver-Capilano the winners were Raymond Joseph Perrault (Liberal) in 1966, David Maurice Brousson (Liberal) at a by-election on 15 July 1968 and at the 1969 and 1972 elections, Gordon Fulerton Gibson (Liberal) at a by-election on 5 February 1974 and in 1975, and Angus Creelman Ree (Social Credit) in 1979, 1983 and 1986. In West Vancouver-Howe Sound, Louis Allan Williams won in 1966, 1969 and 1972 for the Liberal Party and in 1975 and 1979 for Social Credit. John Douglas Reynolds (Social Credit) won there in 1983 and 1986.

Dalton won again in 1996 with 16,675 votes (71.29%). The 1987 to 2001 volume notes that he sat as an Independent during 2000. In 2001 Ralph Sultan of the Liberal Party won with 15,556 votes (72.69%), while Dalton, running as an Independent, received 1,355 (6.33%). Sultan won again in 2005, 2009, 2013 and 2017. Karin Kirkpatrick won in 2020 for the BC Liberal Party with 12,734 votes (53.55%). In 2024 Lynne Block of the Conservative Party won with 12,049 votes (46.67%).

The commission's 2023 final report proposed extending West Vancouver-Capilano to include the neighbourhoods south of the Upper Levels Highway, which reduces the population of West Vancouver-Sea to Sky. Elections BC's conversion table matches the district's 72 voting areas to the 2017 to 2024 districts: 67 in West Vancouver-Capilano and 4 in West Vancouver-Sea to Sky.

Sources: Elections BC (opens in a new tab), Elections BC (opens in a new tab), Elections BC (opens in a new tab), Elections BC (opens in a new tab), Elections BC (opens in a new tab), British Columbia Electoral Boundaries Commission (opens in a new tab)

Members for West Vancouver-Capilano
ParliamentIt satMemberElected asParty on the legislature’s record
43rd2025 to 2026Lynne BlockConservative PartyConservative Party of BC
42nd2020 to 2024Karin KirkpatrickBC Liberal PartyBC United
41st2017 to 2020Ralph SultanBC Liberal PartyBC Liberal Party
40th2013 to 2017Ralph SultanBC Liberal PartyBC Liberal Party
39th2009 to 2013Ralph SultanBC Liberal PartyBC Liberal Party
38th2005 to 2009Ralph SultanBC Liberal PartyBC Liberal Party
37th2001 to 2005Ralph SultanBC Liberal Party
36th1996 to 2001Jeremy DaltonIndependent
35th1992 to 1996Jeremy DaltonBC Liberal Party

“Elected as” is the affiliation Elections BC printed with the winning result. The last column is the party the legislature’s records give for that parliament, which differs when a member changed party while in office. A row with that column empty is a winner Elections BC prints whom the legislature’s records leave out. Source: Legislative Assembly of British Columbia (opens in a new tab)

Boundaries since 2024

West Vancouver-Capilano has 72 voting areas. 67 of them overlap the district of the same name used from 2017 to 2024.Others overlap these districts from 2017 to 2024: West Vancouver-Sea to Sky (4).

The commission that drew the boundaries counted 62,569 people in the district, 16.4% above the average for a district, over 81 km².

Sources: British Columbia Electoral Boundaries Commission, Final report, April 3, 2023 (opens in a new tab), Elections BC, Voting area conversion table, 2017 to 2024 (opens in a new tab)

PAST RESULTS

Every result since 2005

From Elections BC
2024 Provincial General ElectionLynne Block, Conservative Party, 46.67%
CandidateAffiliationVotesShare
Lynne BlockElectedConservative Party12,04946.67%
Sara EftekharBC NDP7,00627.14%
Karin KirkpatrickIndependent5,32620.63%
Archie KaarioBC Green Party1,4355.56%

25,816 valid votes · 42 rejected ballots · 44,114 registered voters · 58.62% voted

2020 General ElectionKarin Kirkpatrick, BC Liberal Party, 53.55%
CandidateAffiliationVotesShare
Karin KirkpatrickElectedBC Liberal Party12,73453.55%
Amelia HillBC NDP7,19430.25%
Rasoul NarimaniBC Green Party3,66415.41%
Anton ShendrykIndependent1860.78%

23,778 valid votes · 228 rejected ballots

2017 General ElectionRalph Sultan, BC Liberal Party, 57.15%
CandidateAffiliationVotesShare
Ralph SultanElectedBC Liberal Party13,59657.15%
Mehdi RusselBC NDP5,62223.63%
Michael MarkwickBC Green Party4,57019.21%

23,788 valid votes · 169 rejected ballots

2013 General ElectionRalph Sultan, BC Liberal Party, 67.03%
CandidateAffiliationVotesShare
Ralph SultanElectedBC Liberal Party15,77667.03%
Terry PlattBC NDP5,26722.38%
David JonesConservative1,1564.91%
Michael MarkwickIndependent1,0184.33%
Tunya AudainLibertarian3201.36%

23,537 valid votes · 195 rejected ballots

2009 General ElectionRalph Sultan, BC Liberal Party, 67.48%
CandidateAffiliationVotesShare
Ralph SultanElectedBC Liberal Party15,29267.48%
Terry PlattBC NDP3,29114.52%
Ryan WindsorBC Green Party1,6997.50%
David Owen MarleyIndependent1,4896.57%
Eddie PetrossianConservative7103.13%
Tunya AudainLibertarian1820.80%

22,663 valid votes · 109 rejected ballots

2005 General ElectionRalph Sultan, BC Liberal Party, 68.27%
CandidateAffiliationVotesShare
Ralph SultanElectedBC Liberal Party14,66568.27%
Terry PlattBC NDP3,90018.15%
Lee WhiteBC Green Party2,64812.33%
Jodie Joanna Giesz-RamsayBC Marijuana Party1470.68%
Ben WestWork Less Party1220.57%

21,482 valid votes · 123 rejected ballots

The boundaries changed before the 2009, 2017 and 2024 elections, so a result under the same name can cover a different area. Sources: Elections BC, Provincial Voting Results (opens in a new tab), Statement of Votes, 2024 Provincial General Election (opens in a new tab)

PEOPLE · 2021 CENSUS

Who lives in West Vancouver-Capilano

62,585 residents · British Columbia beside each figure

Age

Median age
48.4BC 42.8
  • Under 1514.7%BC 14.3%
  • 15 to 6460.1%BC 65.3%
  • 65 and over25.2%BC 20.3%
  • 85 and over4.8%BC 2.4%

Households

Households
24,510
People per household
2.5BC 2.4

Who lives together

  • Couples with children30.4%BC 22.7%
  • Couples without children24.4%BC 26.4%
  • One-parent families8.8%BC 7.6%
  • Multigenerational households2.7%BC 3.7%
  • People living alone26.5%BC 29.4%

Household size

  • 1 person26.5%BC 29.4%
  • 2 persons31.9%BC 35.3%
  • 3 persons16.5%BC 14.5%
  • 4 persons16.9%BC 12.6%
  • 5 or more persons8.1%BC 8.2%

Homes

Median home value
$2,200,000BC $785,000
Median monthly rent and utilities
$2,000BC $1,370
Median monthly cost for owners
$1,700BC $1,320

Own or rent

  • Own their home69.3%BC 66.8%
  • Rent their home30.7%BC 32.8%

Type of home

  • Single-detached house51.7%BC 42.4%
  • Semi-detached house1.6%BC 3.1%
  • Row house2.4%BC 8.3%
  • Apartment or flat in a duplex12.7%BC 12.2%
  • Apartment in a building that has fewer than five storeys9.7%BC 20.4%
  • Apartment in a building that has five or more storeys21.9%BC 10.9%

When the home was built

  • 1960 or earlier26.1%BC 12.5%
  • 1961 to 198033.4%BC 27.0%
  • 1981 to 199011.6%BC 14.2%
  • 1991 to 20008.7%BC 16.5%
  • 2001 to 20053.6%BC 6.0%
  • 2006 to 20104.6%BC 8.0%
  • 2011 to 20155.9%BC 6.6%
  • 2016 to 20216.1%BC 9.1%

Housing costs

  • Renters paying 30% or more of income on housing54.0%BC 37.8%
  • Owners paying 30% or more of income on housing30.6%BC 19.3%
  • Renters in core housing need30.1%BC 24.7%
  • Owners in core housing need10.3%BC 8.0%
  • Renters in subsidized housing7.8%BC 11.0%
  • Owners with a mortgage47.2%BC 57.5%

Income

Income is for the year 2020.

Median household income
$105,000BC $85,000
After tax
$90,000BC $76,000
Median income per person
$44,000BC $40,800

Living on a low income (after-tax measure)

  • All ages12.8%BC 10.8%
  • Under 1815.1%BC 11.3%
  • 18 to 6412.8%BC 9.7%
  • 65 and over10.9%BC 13.8%

Languages

First language learned

  • English56.0%BC 67.1%
  • Iranian Persian13.0%BC 0.9%
  • Mandarin9.5%BC 4.1%
  • Yue (Cantonese)2.1%BC 3.9%
  • Korean1.9%BC 1.2%
  • Spanish1.3%BC 1.2%
  • German1.3%BC 1.0%
  • Persian (Farsi)1.2%BC 0.1%
  • French1.1%BC 1.2%
  • Russian0.9%BC 0.6%

Spoken most often at home

  • English69.9%BC 78.5%
  • Iranian Persian9.5%BC 0.7%
  • Mandarin7.8%BC 3.3%
  • Korean1.2%BC 0.9%
  • Yue (Cantonese)1.0%BC 2.8%
  • Persian (Farsi)1.0%BC 0.1%
  • Spanish0.8%BC 0.6%
  • Russian0.5%BC 0.3%

English and French

  • English only86.0%BC 90.1%
  • English and French10.7%BC 6.6%
  • Neither English nor French3.3%BC 3.3%

Immigration

Born outside Canada (immigrants)
43.7%BC 29.0%
Non-permanent residents
4.1%BC 3.5%

Where immigrants were born

  • Iran29.0%BC 3.2%
  • China19.6%BC 15.3%
  • United Kingdom10.1%BC 8.2%
  • United States of America3.9%BC 4.2%
  • Korea, South3.2%BC 3.3%
  • Hong Kong2.7%BC 5.5%
  • Philippines2.6%BC 9.2%
  • Germany2.1%BC 2.2%
  • Oceania and other places of birth1.7%BC 2.3%
  • South Africa, Republic of1.6%BC 1.1%

When immigrants arrived

  • Arrived before 198020.1%BC 19.7%
  • 1980 to 19909.1%BC 11.5%
  • 1991 to 200017.4%BC 21.0%
  • 2001 to 201025.8%BC 22.2%
  • 2011 to 202127.7%BC 25.6%

Generations in Canada

  • First generation50.0%BC 33.7%
  • Second generation21.5%BC 21.7%
  • Third generation or more28.5%BC 44.5%

Identity and origins

Indigenous identity
1.1%BC 5.9%
Visible minority
42.6%BC 34.4%

Visible minority groups

  • Chinese15.3%BC 11.2%
  • West Asian14.9%BC 1.4%
  • South Asian3.3%BC 9.6%
  • Korean2.0%BC 1.5%
  • Filipino1.5%BC 3.5%
  • Multiple visible minorities1.2%BC 1.2%
  • Latin American1.1%BC 1.3%
  • Japanese1.1%BC 0.9%
  • Arab0.6%BC 0.6%
  • Southeast Asian0.5%BC 1.5%
  • Visible minority (other)0.5%BC 0.4%
  • Black0.4%BC 1.3%

Ethnic or cultural origins reported most often

  • English19.9%BC 20.7%
  • Scottish14.5%BC 15.8%
  • Chinese14.3%BC 10.5%
  • Iranian12.8%BC 1.0%
  • Irish11.6%BC 12.8%
  • German8.0%BC 11.0%
  • Canadian7.0%BC 9.3%
  • British Isles5.1%BC 3.9%
  • Persian4.7%BC 0.4%
  • French4.2%BC 6.4%

Religion

  • No religion52.0%BC 52.1%
  • Christian32.2%BC 34.3%
  • Muslim11.1%BC 2.6%
  • Other religions1.6%BC 1.0%
  • Buddhist1.3%BC 1.7%
  • Jewish0.9%BC 0.5%
  • Hindu0.4%BC 1.7%
  • Sikh0.3%BC 5.9%
  • Traditional Indigenous spirituality0.0%BC 0.2%

Education

Highest level completed, ages 25 to 64.

  • No certificate, diploma or degree1.9%BC 8.0%
  • High school diploma15.5%BC 25.8%
  • College, trades or other certificate below a bachelor’s degree21.4%BC 31.2%
  • Bachelor’s degree or higher61.3%BC 35.0%

Work

In the labour force
56.5%BC 63.3%
Employed
51.3%BC 57.9%
Unemployment rate at the census
9.2%BC 8.4%

Industries with the most workers

  • Professional, scientific and technical services17.3%BC 9.2%
  • Retail trade11.3%BC 11.6%
  • Health care and social assistance10.8%BC 12.3%
  • Educational services7.6%BC 7.4%
  • Finance and insurance7.6%BC 3.7%
  • Construction6.2%BC 9.0%
  • Real estate and rental and leasing6.1%BC 2.3%
  • Accommodation and food services5.5%BC 7.0%

Kinds of work

  • Sales and service occupations23.5%BC 25.6%
  • Business, finance and administration occupations23.3%BC 17.1%
  • Occupations in education, law and social, community and government services12.4%BC 11.9%
  • Natural and applied sciences and related occupations10.1%BC 8.0%
  • Trades, transport and equipment operators and related occupations8.7%BC 18.0%
  • Health occupations7.7%BC 7.7%
  • Occupations in art, culture, recreation and sport7.1%BC 4.2%
  • Legislative and senior management occupations4.9%BC 1.2%
  • Occupations in manufacturing and utilities1.2%BC 3.4%
  • Natural resources, agriculture and related production occupations1.1%BC 2.8%

Getting to work

Where people worked

  • Worked at home37.8%BC 22.6%
  • Worked outside Canada1.2%BC 0.4%
  • No fixed workplace address9.8%BC 15.3%
  • Worked at a usual workplace51.2%BC 61.6%

How commuters travelled

  • Car, truck or van77.0%BC 79.9%
  • Public transit9.7%BC 9.3%
  • On foot7.5%BC 6.5%
  • Bicycle1.9%BC 2.0%
  • Other method4.0%BC 2.3%

Length of the trip

  • Less than 15 minutes28.1%BC 31.8%
  • 15 to 29 minutes40.3%BC 34.0%
  • 30 to 44 minutes20.4%BC 19.7%
  • 45 to 59 minutes6.8%BC 7.3%
  • 60 minutes and over4.3%BC 7.2%

Moving

Where residents lived five years before the census.

  • Lived at the same address60.5%BC 56.2%
  • Moved within the same municipality12.1%BC 16.1%
  • Moved from elsewhere in BC15.4%BC 17.0%
  • Moved from another province2.8%BC 4.6%
  • Moved from another country9.2%BC 6.1%

Counts in the census are rounded to the nearest 5, and shares are worked out from those counts. Source: BC Stats, from Statistics Canada tabulations, 2021 Census Profile for BC Provincial Electoral Districts (2023 Redistribution) (opens in a new tab)

QUESTIONS

Questions about West Vancouver-Capilano

10 answers

Where is West Vancouver-Capilano?

West Vancouver-Capilano is a provincial electoral district on the north shore of Burrard Inlet in British Columbia. The Electoral Boundaries Commission's 2023 final report gives its area as 81 square kilometres. It takes in West Vancouver east of Cypress Creek and Rodgers Creek, and the part of the District of North Vancouver between the Capilano River and Lonsdale Avenue.

Which communities are in West Vancouver-Capilano?

West Vancouver-Capilano includes West Vancouver's city centre, Ambleside, Park Royal, Dundarave, Sandy Cove, Pemberton Heights and the part of Westmount south of the Upper Levels Highway, according to the commission's 2023 final report. The commission's map also labels Altamont, Hollyburn, Cedardale, Glenmore, Delbrook, Forest Hills, Capilano Highlands, Canyon Heights and Cleveland Park.

Who won West Vancouver-Capilano in the 2024 provincial election?

Lynne Block of the Conservative Party won West Vancouver-Capilano in 2024 with 12,049 votes, 46.67% of the valid vote. Sara Eftekhar of the BC NDP received 7,006 votes, Karin Kirkpatrick as an Independent received 5,326 and Archie Kaario of the BC Green Party received 1,435. Turnout was 58.62% of 44,114 registered voters.

Who represented West Vancouver-Capilano before 2024?

Karin Kirkpatrick represented West Vancouver-Capilano before 2024. She won in 2020 for the BC Liberal Party with 12,734 votes, 53.55%. Ralph Sultan of the Liberal Party won the district in 2001, 2005, 2009, 2013 and 2017. Jeremy Dalton won it in 1991 and 1996, the first two elections at which the district name was used.

When was West Vancouver-Capilano first created?

The name West Vancouver-Capilano was first used at the 35th general election on 17 October 1991, under the Electoral Districts Act of 1990, which set out 75 single-member districts. Jeremy Dalton of the Liberal Party won that election in West Vancouver-Capilano with 13,194 votes, 56.63%. Elections BC's volume for 1987 to 2001 prints the result.

Were there earlier districts with similar names?

Yes. Before West Vancouver-Capilano appeared in 1991, Elections BC lists North Vancouver-Capilano and West Vancouver-Howe Sound, both created in 1966 and both contested until 1986. Angus Creelman Ree won North Vancouver-Capilano for Social Credit in 1979, 1983 and 1986. John Douglas Reynolds won West Vancouver-Howe Sound for Social Credit in 1983 and 1986.

How did the boundaries of West Vancouver-Capilano change in 2023?

The Electoral Boundaries Commission's 2023 final report proposed extending West Vancouver-Capilano to include the neighbourhoods south of the Upper Levels Highway, which reduces the population of West Vancouver-Sea to Sky. Of the district's 72 voting areas, 67 were in the earlier West Vancouver-Capilano and 4 in West Vancouver-Sea to Sky. The report counts 62,569 people, a deviation of 16.4% from the average.

How many people live in West Vancouver-Capilano?

The 2021 census counted 62,585 people in West Vancouver-Capilano, with a median age of 48.4 compared with 42.8 across British Columbia. English was the first language of 56% of residents, Iranian Persian of 13% and Mandarin of 9.5%. Immigrants made up 43.7% of the population, and the median household income was $105,000.

Whose traditional territory is West Vancouver-Capilano on?

The Squamish Nation's website says its traditional territory includes all of West Vancouver. The Tsleil-Waututh Nation's website names the Capilano River among the rivers where its families gathered to fish for salmon. Each Nation's own page, listed under sources, gives its own account of its territory.

Where does the name Capilano come from?

BC Geographical Names says Capilano comes from the Squamish word Kiapila'noq, the hereditary title of a Squamish chief whose village stood at the mouth of the creek. The name was adopted as Capilano Creek on 31 March 1917 and changed to Capilano River on 6 May 1947. The Capilano River runs through West Vancouver-Capilano.
SOURCES

Where this page comes from

Figures read Thursday, October 8, 2026
  1. 2021 Census Profile for BC Provincial Electoral Districts (2023 Redistribution) (opens in a new tab)BC Stats, from Statistics Canada tabulations · read Thursday, October 8, 2026
  2. Provincial Voting Results (opens in a new tab)Elections BC · read Thursday, October 8, 2026
  3. Statement of Votes, 2024 Provincial General Election (opens in a new tab)Elections BC · read Thursday, October 8, 2026
  4. Voting area conversion table, 2017 to 2024 (opens in a new tab)Elections BC · read Thursday, October 8, 2026
  5. Final report, April 3, 2023 (opens in a new tab)British Columbia Electoral Boundaries Commission · read Thursday, October 8, 2026
  6. Members of the Legislative Assembly, 35th to 43rd Parliament (opens in a new tab)Legislative Assembly of British Columbia · read Thursday, October 8, 2026
  7. Final report, April 3, 2023 (opens in a new tab)British Columbia Electoral Boundaries Commission · read Wednesday, October 7, 2026
  8. Electoral History of British Columbia, 1871 to 1986 (opens in a new tab)Elections BC · read Wednesday, October 7, 2026
  9. Electoral History of British Columbia, Supplement, 1987 to 2001 (opens in a new tab)Elections BC · read Wednesday, October 7, 2026
  10. Electoral History of British Columbia, Supplement, 2002 to 2013 (opens in a new tab)Elections BC · read Wednesday, October 7, 2026
  11. Provincial Voting Results (opens in a new tab)Elections BC · read Wednesday, October 7, 2026
  12. Statement of Votes, 2024 Provincial General Election (opens in a new tab)Elections BC · read Wednesday, October 7, 2026
  13. Our Land (opens in a new tab)Squamish Nation (Sḵwx̱wú7mesh Úxwumixw) · read Thursday, October 8, 2026
  14. Our History (opens in a new tab)Squamish Nation (Sḵwx̱wú7mesh Úxwumixw) · read Wednesday, October 7, 2026
  15. About Tsleil-Waututh Nation (opens in a new tab)Tsleil-Waututh Nation (səlilwətaɬ) · read Wednesday, October 7, 2026
  16. Our Story (opens in a new tab)Tsleil-Waututh Nation (səlilwətaɬ) · read Wednesday, October 7, 2026
  17. Capilano River, BC Geographical Names record (opens in a new tab)BC Geographical Names Office · read Wednesday, October 7, 2026
  18. West Vancouver, BC Geographical Names record (opens in a new tab)BC Geographical Names Office · read Wednesday, October 7, 2026
  19. A brief history of the North Shore (opens in a new tab)North Shore Heritage Preservation Society · read Wednesday, October 7, 2026
  20. History (opens in a new tab)West Vancouver Police Department · read Wednesday, October 7, 2026
  21. West Vancouver (opens in a new tab)The Canadian Encyclopedia · read Wednesday, October 7, 2026
  22. North Vancouver (opens in a new tab)The Canadian Encyclopedia · read Wednesday, October 7, 2026
  23. Lions Gate Bridge (opens in a new tab)The Canadian Encyclopedia · read Wednesday, October 7, 2026
  24. You should know the awesome history of the long forgotten North Shore ferries (opens in a new tab)Scout Magazine · read Wednesday, October 7, 2026
  25. Dundarave, The Encyclopedia of Raincoast Place Names (opens in a new tab)KnowBC · read Wednesday, October 7, 2026
  26. History (opens in a new tab)British Properties (British Pacific Properties) · read Wednesday, October 7, 2026
  27. About Park Royal (opens in a new tab)Park Royal · read Wednesday, October 7, 2026
  28. Cleveland Dam fact sheet (opens in a new tab)Metro Vancouver · read Wednesday, October 7, 2026

Official information

From Elections BC
CORRECTIONS

Report a problem on this page.

Tell the editors what is wrong and where the correct information can be checked. The page you are on is attached automatically.